Why Your Organization Should Move from Business Intelligence to Decision Intelligence
There has been a lot of buzz around decision intelligence (DI) recently. By 2030, 70% of firms, according to McKinsey, would employ decision intelligence in one way or another.
Organizations are more likely to be data-driven as the popularity of big data and cloud computing continues to soar. Organizations who earlier desired to be data-first entities are now searching for more beyond merely being data-driven due to new difficulties and keeping competitive at the forefront.
It’s time to comprehend why businesses require decision intelligence now that we are aware of the advantages of business intelligence on both the technological and commercial fronts.
According to Gartner’s research, “Dashboards are a reporting mechanism that
aggregates and displays metrics and key indicators so they can be examined at a
glance by all possible audiences.”
To make the move from operating a business based on intuition to operating it with intelligence, all data-driven enterprises require sophisticated business intelligence solutions. Many people find it difficult to know where to begin. Using data to enhance business results is a skill that is famously hard to acquire since information is flooding in from an almost infinite number of systems and apps.
Data visualization
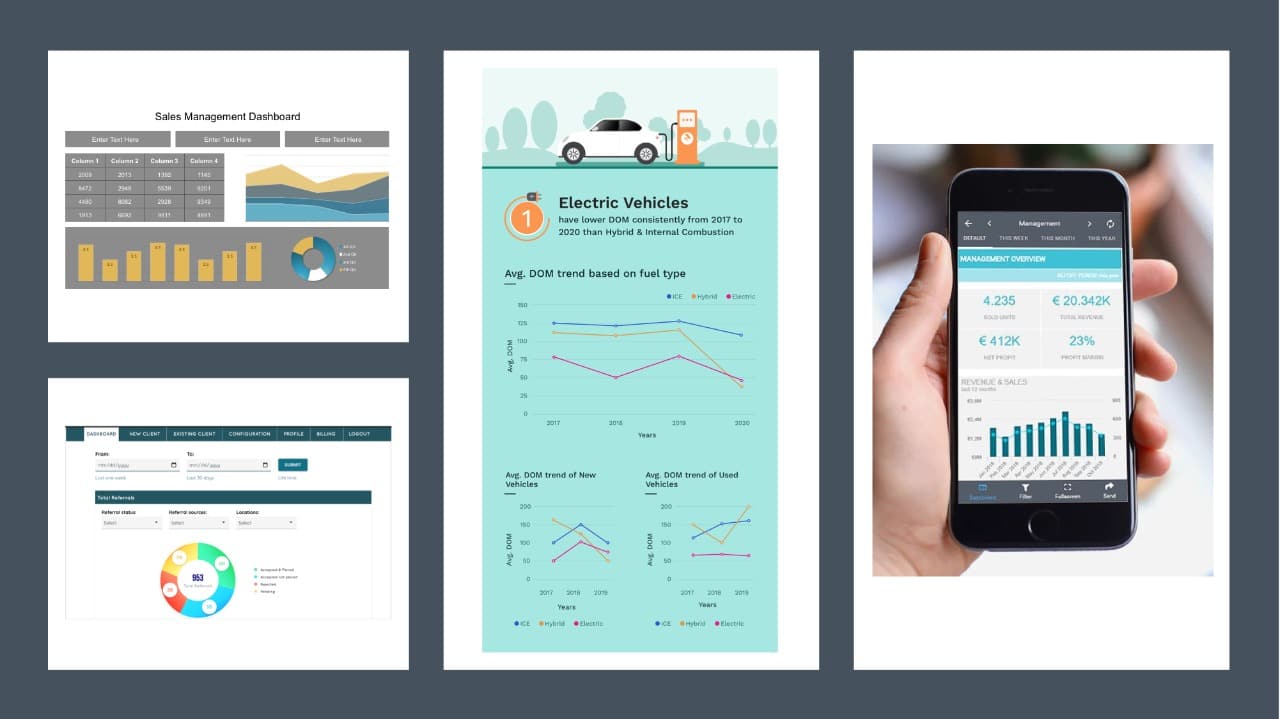
Visualization is the process of presenting the information and dashboards that aggregate and show this information come in different shapes, sizes, and for different needs as depicted below. They could be an independent web dashboard or an embedded report within an application, an infographic, or a mobile dashboard.
With the advent of different kinds of data (both large and wide), different techniques, and tools, the implementation of visualization projects is now driven by questions like:
- How is this information aggregated?
- Where is this information consumed?
- Who is this information aimed at?
- What is this information being used for?
We know that reports and dashboards have been in vogue for a while, so what changed? Interestingly, quite a bit has changed though the fundamentals remain the same. Let’s find out:
Decision intelligence
Dumping data and information on a visualization tool is only going to make it a busy dashboard and not a useful one. Hence the need to understand what metrics make sense and prioritize. Focus on what “decisions” the users of the dashboard can make or infer based on the visual. So, move towards Decision Intelligence.
Exploratory insights
Earlier, reporting and dashboards were typically used for well-understood areas of business for descriptive analysis. Now, things have changed (and for good). Companies now want to look at exploratory data. Data that isn’t very clear, if presented and given the ability to slice and dice, with an option to create self-service style visuals would become a great feature to have for a business. It also makes a more compelling use case for dashboards and visualizations in general. So, focus on deriving unknown/exploratory insights.
New age data visualization
In line with the rest of the technology trends, it is now a hygiene factor to have the ability to integrate advanced analytics within a report (without the need for data science practitioners chipping in) or ask question that needs to be answered through a voice or text. Ask the question (and tweak it) to see the information presented dynamically. Ask differently and get more from the data.
Hyper-personalization
Different people have different expectations from reports and dashboards. Hence the design and metrics need to talk to the user and their role. Yes, this might sound like we are heading towards hyper-personalization in visualization, but that’s not an exaggeration.
Use the right tool
Like everything thing else in the tech space, visualization has moved to the cloud (for scalability and maintainability reasons) and more importantly because newer features are being released in the cloud version first and only then in the on-premises edition (if for some reason a tool has both). Learn, adapt, and use that new and shiny tool.
Design over tool
More and more people are interested in consuming reports from where they are – be it embedded reports within a web application or a mobile version of the dashboard or maybe an infographic within a journal. This ease of consumption is driving the tools needed to render the right kind of visualization. Get your design right and then decide on the tool.
This space is only going to get even more crowded and exciting. We will probably see a lot more extended reality, augmented analytics, and cloud-based platforms for handling visualization needs. So, what do we do?
This again takes us back to the basics:
- People
- Process
- Technology
The people aspect
BI engineers, data analysts, and to a large extent ML engineers have to start thinking of themselves as digital evangelists. How many times have we heard “data-driven enterprises” in the recent past? When you essentially break it down, it means people that can help tell a story of what a business is or what a business “can be” using data. So yes, data analysts, to, storytellers, to, digital agents and evangelists.
The process aspect
This aspect is kind of neglected since visualization somehow is sandwiched between data engineering and machine learning. But, every visualization (reports/dashboards) needs its own lifecycle management, templates for gathering requirements, clearly articulated success criteria, a feasible testing strategy, and a lot more. Time to focus on this aspect and not look at reporting as an afterthought post-product development.
The technology aspect
Not going to deny, this is where it gets clumsy! Whatever tool and tech we decide on, will always have pros and cons. Hence the ideal thing to do here will be to try and get the design right (the pipelines, frequency of refresh, calculations of metrics, deployment of upstream processes). The tool being used for visualization then becomes just that – a tool. That said, keeping an eye on all features and newer tools in this space and building CoEs within the company will become a game-changer.
Conclusion
Organizations that previously relied on dashboards and manual data analysis are shifting to decision intelligence to help their business and analytics teams make better decisions, faster, and more consistently. Data-driven insights are at the core of fostering new business opportunities, enhancing operational efficiency, and fostering customer relationships. Organizations will eventually rely on DI as a common strategy tool to quickly choose the best potential business results.
The path to these results will be swiftly accelerated by DI, which will allow for quicker decision-making while eradicating the frequent mistakes connected to BI, such as multiple versions of the truth, decision latency, and human biases. By 2023, a third (33%) of major businesses, according to Gartner, will have analysts using decision modeling and other forms of decision intelligence.
By uncovering insights that might otherwise take months to uncover and providing suggested next steps, decision intelligence should complement business intelligence. Despite its ability to automate, decision intelligence should only be applied to simple, recurring tasks that are the consequence of automatically surfacing insights.
To know more about decision intelligence and data visualization, please visit Cigniti Business Intelligence / Visualization.

Leave a Reply