SAP Performance Testing – Breaking Down the Longer SAP GUI Response Times
SAP offers one of the best ERP solutions for enterprise business-critical operations. The success of these business operations depends on the reliability of the SAP deployment. Though the SAP solutions are perhaps thoroughly tested, rigorous performance testing is needed to understand the operations behavior of SAP under heavy loads. The number of tests required might depend on the scale of deployment, business modules deployed, integrations, data volumes, customizations, expected workloads, and so on.
You might have come across a situation where E2E performance, especially response times measured at the SAP GUI client end, is quite longer or slower, but processing time on the SAP application end is not that long and not comparable to the response time measured at the SAP GUI side.
Immediately, one might possibly think the network is the bottleneck. Is it correct to say so without gathering sufficient evidence from the SAP application and, for that matter, the network? What is the delta here, and how do we understand what is contributing to that delta? It could be an SAP resource issue like work process, CPU, Extended Memory, Heap Memory, Database SQL performance issues, Network, etc. As a performance engineer or architect, one should be able to gather sufficient evidence of the performance bottlenecks before calling them out. In this blog, we will discuss the approach adopted in troubleshooting the longer response times of the SAP GUI client.
The SAP response time is a critical metric that measures the speed at which the system processes user requests, directly impacting overall performance and user satisfaction.
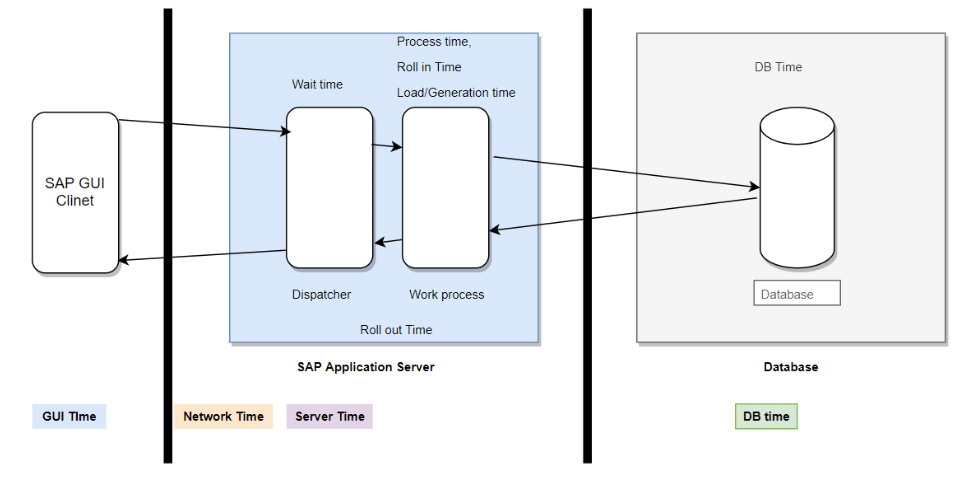
Before diving into the debugging approach, let us understand what E2E response time constitutes from an SAP standpoint, which is essential for better interpreting what is being reported and measured (the following diagram is only for illustrative purposes).
The response time in SAP has been consistently monitored and optimized to ensure seamless performance and efficient business operations.
Response Time: Response time starts when a user request arrives at the dispatcher, and the next screen is loaded for the user.
Wait Time: This is when a request waits at the dispatcher before it is picked up by the work process for processing.
Roll-in Time: It is the time taken to roll user context info from the shared pool to the local working memory of the work process.
Network Time: The network time is the time used in the network during the first data transfer from the front end to the application server and during the last data transfer from the application server to the front end.
Load Time: Time taken to load from the Database and generate ABAP code screen information.
Processing Time: Time taken by the work process to execute ABAP code.
DB Time: Time taken to process user requests from a database standpoint.
GUI Time: It is the time taken between the sap server and the sap client application.
Approach for troubleshooting Longer SAPGUI Response Times
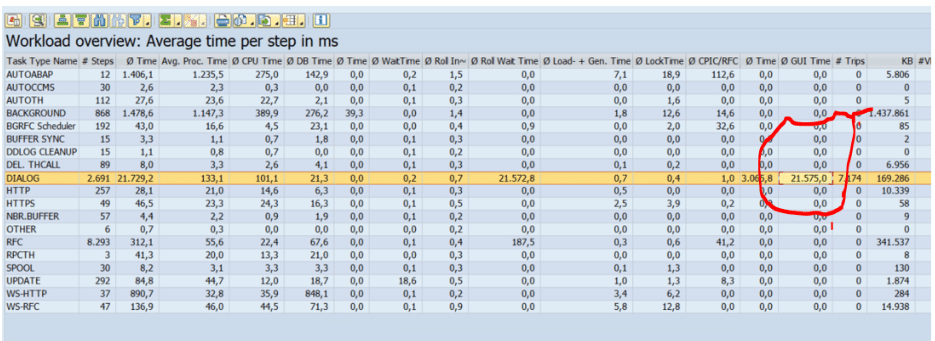
Execute the load test and use ST03 to understand the dialog response times and data transfer rates. Below is a sample capture for SAP standard t code ME51N. It clearly shows the longer GUI Time.
Next, capture the transaction trace for the transaction in scope with or without load to understand which part of ME51N is taking longer. The following trace was taken, which is about 2 seconds longer, and shows that 40% of the time is spent on DELETE WHERE LT_AGR_HIERT. And 35% of the time is spent on RFC OLE_FLUSH_CALL.
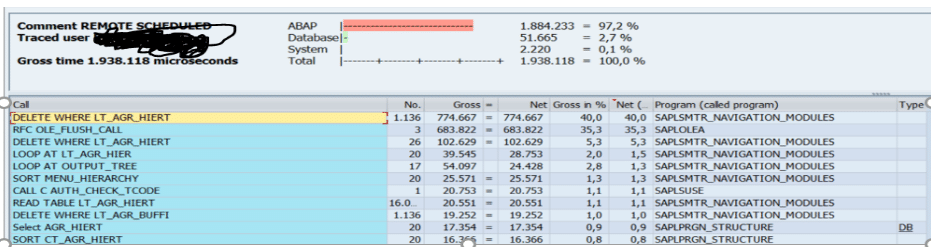
According to STAD/ST03 statistics, the database is not a concern, so investigated into RFC OLE_FLUSH_CALL.
OLE_FLUSH_CALL is related to GUI time, which is our concern.
GUI time is the result of calls to OLE_FLUSH_CALL. GUI time is the time that the work process spends Exchanging data with SAPGUI (Network time) and waiting for SAPGUI to execute the methods in each OLE_FLUSH_CALL (Front End (FE) Interpretation time).
[GUI time (OLE_FLUSH_CALL)] = [Network time] + [FE interpretation time]
Please see SAP Note 2880032-OLE_FLUSH_CALL and GUI time in NetWeaver AS ABAP for more details.
Interpretation time is the time taken to update the SAP GUI after receiving a response from SAP.
Executed the first dialog step of the transaction in question manually three times and validated the interpretation times. As can be seen in the following interpretation, time was only about half a second. So, interpretation time is not a concern—possibly indicating a potential issue at the network.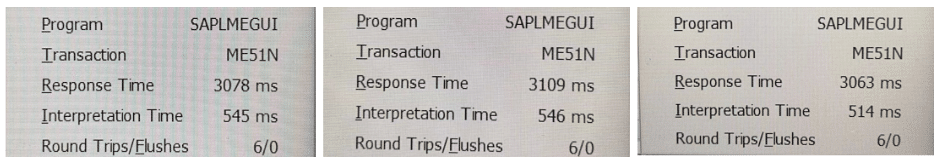
How can we check if the network is slower or has any bandwidth constraints?
Checking the network…
Typical response times for a ping with 4 KB packet sizes are as below.
In a local network (LAN) and in a fast LAN within a continent < 20 milliseconds
In a fast-intercontinental connection < 200 milliseconds
In a slow intercontinental connection < 400 milliseconds
There should not be any pocket/data loss
SAP recommends running NIPING. NIPING is a tool provided by SAP for troubleshooting network latency and bandwidth issues. One would need to run the following three commands and check if the average latency is in an acceptable range.
Start the niping server on a host using
niping -s -I 0
The following should be printed on the terminal after a successful start.
Tue Mar 08 14:36:23 2022
ready for connect from client …
start the niping client on host using
[2] niping -c -H -B 10 -L 100
Below is the expected sample output
Tue Mar 08 14:38:23 2022
connect to server o.k.
Tue Mar 08 14:38:25 2022
send and receive 100 messages (len 10)
——- times —–
avg 26.516 ms
max 29.215 ms
min 26.127 ms
tr 0.737 kB/s
excluding max and min:
av2 26.493 ms
tr2 0.737 kB/s
[3] niping -c -H -B 100000
Below is the expected sample output
Tue Mar 08 14:39:32 2022
connect to server o.k.
Tue Mar 08 14:39:33 2022
send and receive 10 messages (len 100000)
——- times —–
avg 85.861 ms
max 195.038 ms
min 54.491 ms
tr 2274.750 kB/s
excluding max and min:
av2 76.135 ms
tr2 2565.336 kB/s
Analyze the niping bandwidth and latency commands output between the hosts where SAP GUI client is installed and SAP Application servers. Need to look for ways to reduce the roundtrip latency on the network if the latency is well beyond the typical latency expected on the various networks mentioned above.
Performance Assurance is one of the critical nonfunctional testing types that cannot be ignored for even certified products like SAP ECC or SAP HANA because every implementation could be different in terms of customizations, integrations, data volumes, hardware sizing, and network topology.
Performance assurance would add value to business operations in the effort spent and dollars burnt towards performance testing. Performance engineers build the right strategy, design the right workloads, and utilize the right tools and techniques to isolate where the performance bottleneck is and certify the SAP solution from a performance standpoint before promoting it to production. SAP itself provides various T Codes to monitor SAP Dialog step response times and follow various notes on breaking down performance issues and providing recommendations. There could also be cases when SAP GUI times appear to be longer, and there are no issues associated with a network or SAP-the application itself. Then, the next thing to check is the servers being used to simulate SAP GUI load. Typically, 25 Vusers could run well per Windows server.
Conclusion:
Cigniti’s SAP testing practice provides cost-effective solutions that address all types of SAP projects’ needs like Implementations, Upgrades, Rollouts, Migration, and Enhancements.
- Custom SAP testing solutions
- SAP test accelerators in the form of a pre-built test suite for standard SAP business processes and out-of-the-box SAP functionalities
- Ready-to-use test automation frameworks
- 1700+ pre-built Test Cases/Scripts for SAP ECC, S4hana, Success factors etc.
- Pool of highly skilled & certified functional SMEs, Manual and automation testing professionals having in-depth experience in testing all SAP Products and Modules
- Expertise in:
- Digital services related to SAP transformation engagements like Mobile, IoT, Cloud, etc.
- Robot Process Automation (RPA), API Testing in SAP space
- Automating SAP applications using multiple automation tools like UFT, Tosca, Selenium, Ranorex, Worksoft Certify, TAO and CBTA, etc.
- Expertise in testing:
- SAP test accelerators in the form of a pre-built test suite for standard SAP business processes and out-of-the-box SAP functionalities
- Traditional ECC, latest S/4 HANA On-premise, S/4 HANA On-cloud and Hybrid models
- Migration from ECC to S/4 HANA (On-premise, Cloud and Hybrid approaches)
- Latest SAP Cloud products like Ariba, SuccessFactors, Fieldglass, Concur, etc.
- Strong capabilities in testing Artificial Intelligence (AI) and machine learning (e.g., SAP Leonardo, etc.)
- In-house IP (Proprietary) tools like SAP impact analyzer ongoing development.
Schedule a discussion with our ERP Testing and Performance Testing experts to learn more about breaking down longer SAP GUI response times through SAP Performance Testing.


Leave a Reply