An Amazing Open-Source Performance Testing Tool – Jmeter
Introduction:
Why opt for expensive commercial tool licensing and maintenance, when free tools are available in the market. All you need to put in is a little bit of planning and effort.
Jmeter is one of the best leading performance testing tools from Apache open source community. With great community support, the tool supports continuous releases, improvement and meets the needs of the testers along with the needs of the business community.
The Apache JMeter™ is 100% pure Java application designed to load test functional behavior and measure performance. Originally designed for testing Web Applications, the tool has expanded to other test functions. Since the application is written in Java, it can be run on any machine, Windows, Linux or Mac.
Features:
Apache Jmeter is used to test the performance on static as well as dynamic resources (Files, Web dynamic languages – PHP, Java, ASP.NET, Java Objects, Data Bases and Queries, FTP Servers and more). It is also used to simulate a heavy load on a server, group of servers, network or object to test its strength or to analyze overall performance under different load types. You can also use it to make a graphical analysis of performance or to test your server/script/object behavior under heavy concurrent load.
» Ability to load and performance test across many different server/protocol types:
- Web : HTTP, HTTPS,CITRIX
- Web Services: XML/SOAP, REST.
- FTP
- Database via JDBC
- LDAP
- Message-oriented middleware (MOM) via JMS
- Mail – SMTP(S), POP3(S) and IMAP(S)
- MongoDB (NoSQL)
- Native commands or shell scripts
- TCP
The tool’s benefits include:
» Complete portability and 100% Java purity.
» Full multithreading framework which enables concurrent sampling by many threads and simultaneous sampling of different functions by separate thread groups.
» A GUI design that allows faster Test Plan building and debugging.
» Caching and offline analysis/replaying of test results.
» Highly Extensible core. The core in itself offers immense value with
- Pluggable Samplers which allow unlimited testing capabilities.
- Several load statistics may be choosen with pluggable timers.
- Data analysis and visualization plugins which allow great extensibility as well as personalization.
- Functions can be used to provide dynamic input to a test or provide data manipulation.
- Scriptable Samplers (BeanShell, BSF-compatible languages and JSR223-compatible languages)
Typical Jmeter Test Plan:
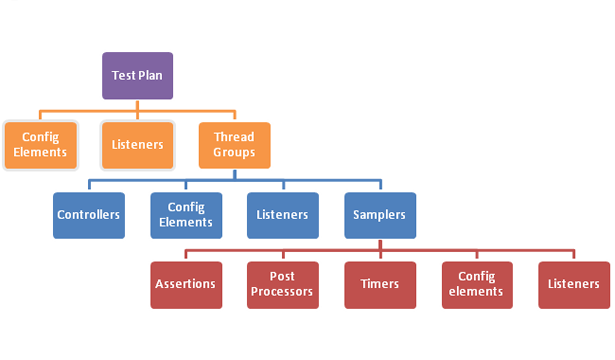
From the above diagram, it is clear that Listeners and Config elements can be configured at any level, thus defining the scope for them. If the listeners are defined at the Sampler level, they work only for that sampler. If they are defined at the thread group level, they can work with all the samplers under the thread group. If they are defined at the Test Plan level, they are applicable to all the thread groups and all the samplers under the thread groups.
However, this works a little different for the Config elements. Each of the config elements have their own scope which would be explained in detail at the Config Elements section.
Test Plan
A test plan contains the overall settings of the performance test. A test plan can have multiple Config elements, listeners and Thread Groups. The test plan can control the execution (parallel or sequential) of thread groups and can also be used to save the responses.
Thread Group
A thread group is where the number of threads (users), ramp-up rate and the start times of the thread group are defined. All the items under a thread group are executed by multiple threads/users. A thread group can have multiple samplers, config elements, controllers etc.
Samplers
These are the actual requests made from the JMeter tool. These samplers can be a HTTP Request, Web Service request or JDBC request or can be even a java request. For performance testing the web applications using JMeter, each thread group will have several HTTP requests which will be executed by multiple threads concurrently and thus causing the load on the web application.
Config Elements
Config elements are the ones which can be configured the way the samplers /thread groups / test plan are executed. The most commonly used HTTP config elements are HTTP Cookie Manager, HTTP Cache manager, HTTP Auth Manager. Similarly to run a JDBC sampler, the JDBC config element has to be specified.
Controllers
Controllers are used to control the flow of a thread through the thread group. All the conditions like If, for, while etc. are the examples of Controllers.
Assertions
Assertions are required to validate the response that is received when a request (a sampler is executed) is made to the application. The assertions can be text assertions, XML assertions, Xpath etc.
Post Processors
Once a response is received for a particular sampler request, Post processors are used to perform actions. The most commonly used post processor is the regular expression extractor.
Timers
Timers are used to delay the execution of the thread or to make the thread wait for the specified time. The commonly used timers are constant timer, Gaussian random timer etc.
Listeners
Listeners are the reporting entity of JMeter which can be configured at the sampler / thread group /test plan level. The most commonly used listeners are View results tree, View results summary and aggregate report.
Third party plugins for Jmeter
The JMeter tool itself has a strong position in the world of performance testing, because it offers professional level features, comparable to commercial tools, and still stays free and open source. However, out-of-the-box JMeter has some weak points, mainly a lack of reporting features and visualizations.
JP@GC targets this weak point and offers several groups of test results visualization plugins. It is a popular third-party plugins set which extends Meter’s functionality with a multiple graphs, new load delivery controllers and other functions that are missing from the original JMeter package. Basically, the JP@GC set contains two types of plugins: graph plugins and JMeter functionality extensions.
JC@GC functionality extensions for Jmeter:
Ultimate Thread Group: “Ultimate” means there will be no need in further Thread Group plugins.
- Infinite number of schedule records
- Separate ramp-up time, shutdown time, flight time for each schedule record
- And, of course, trustworthy load preview graph
- infinite number of schedule records
- separate ramp-up time, shutdown time, flight time for each schedule record
Stepping Thread Group: JMeter has only one out-of-the-box option for threads (users) scheduling: simple ramp-up. But many users, especially the users with experience on HP LoadRunner are used to a flexible thread scheduling algorithm. Stepping Thread Group adds a thread scheduling similar to LoadRunner.
- preview graph showing estimated load (see example screen below)
- initial thread group delay to combine several thread group activities
- increase load by portions of threads (users) with ramp-up period
- configurable hold time after all threads started
- decrease load by portions
Timeline – Graphs:
JP@GC plugin is providing the timeline based graphs which have all names like Over Time, per Second. Timeline graphs visualize the results during the test run, and also can load non-GUI JMeter test results from JTL files. The available timeline data types to plot are: response times, server hits (transactions) per second, response codes, active JMeter thread counts.
Sample Graphs:
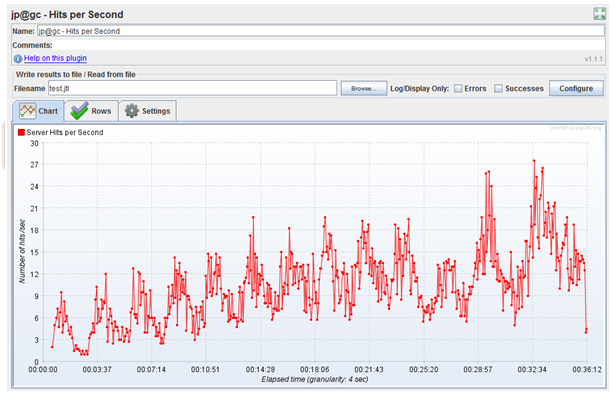
jp@gc – Hits per Seconds: This graph will display the hits generated by the test plan to the server per second. Hits include child samples from transactions and embedded resources hits.
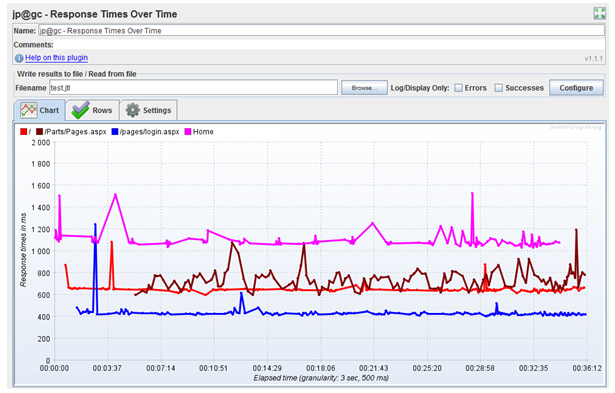
jp@gc – Response Time Over Time: This graph will display the average response time in milliseconds for each sampler.
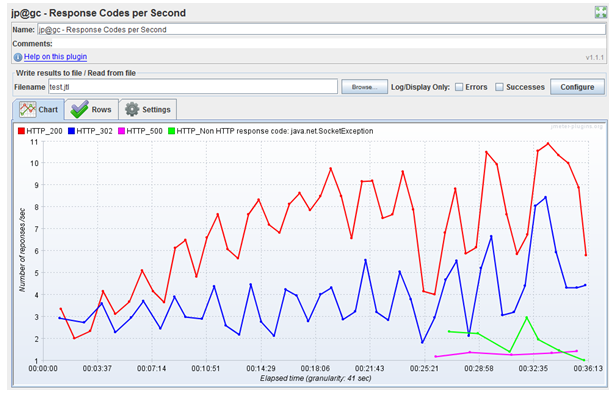
jp@gc – Response Code per Seconds: This graph provides the response code per second.
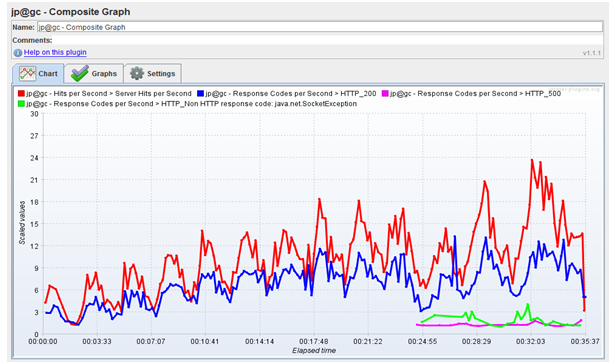
Composite Graph: is a special plugin that does not collect data itself, but uses other timelines as a source. You can aggregate different data in one graph to track correlation between test parameters and examine how response time depends on active threads count. Since PerfMon Metrics Collector has also a timeline type, it can be used as a source for Composite Graph.
Target Resource Monitoring:PerfMon Metrics Collector is the most popular component of the jmeter-plugins set. It allows to monitor the resources usage of the target computer within JMeter. It requires a special ServerAgent process to be started at target computer and plots collected data on nice graph.
PerfMon plugin supports collecting an unlimited number of metrics at the same time. It can collect over 75 separate metric types in groups: CPU, Memory, Disk, Network, Swap, TCP statistics, Java JMX metrics. Per-process and system total metrics are supported. In case you need to collect a custom metric that is calculated by your program/script, you may use the Custom metric type.
Refer to the following link for more details on Jmeter & downloads
http://jmeter.apache.org/download_jmeter.cgi


Comments (2)
btw, it’s not an either-or situation. LoadRunner can run Jmeter (as well as Junit, Nunit, and Selenium). Additionally, LoadRunner no longer has a 10-day limit. You can run 50 vusers free.
This is perfect process explanation. thank you so much for sharing.Introduction of Jmeter